This is my personal blog. The views expressed on these pages are mine alone and not those of my employer. This is not AI. All hallucinations are my own human ones.
More FT8 propagation
Last month I graphed the distance to remote stations as a function of time of day.
Today I plotted the gridsquare locations on a world map:
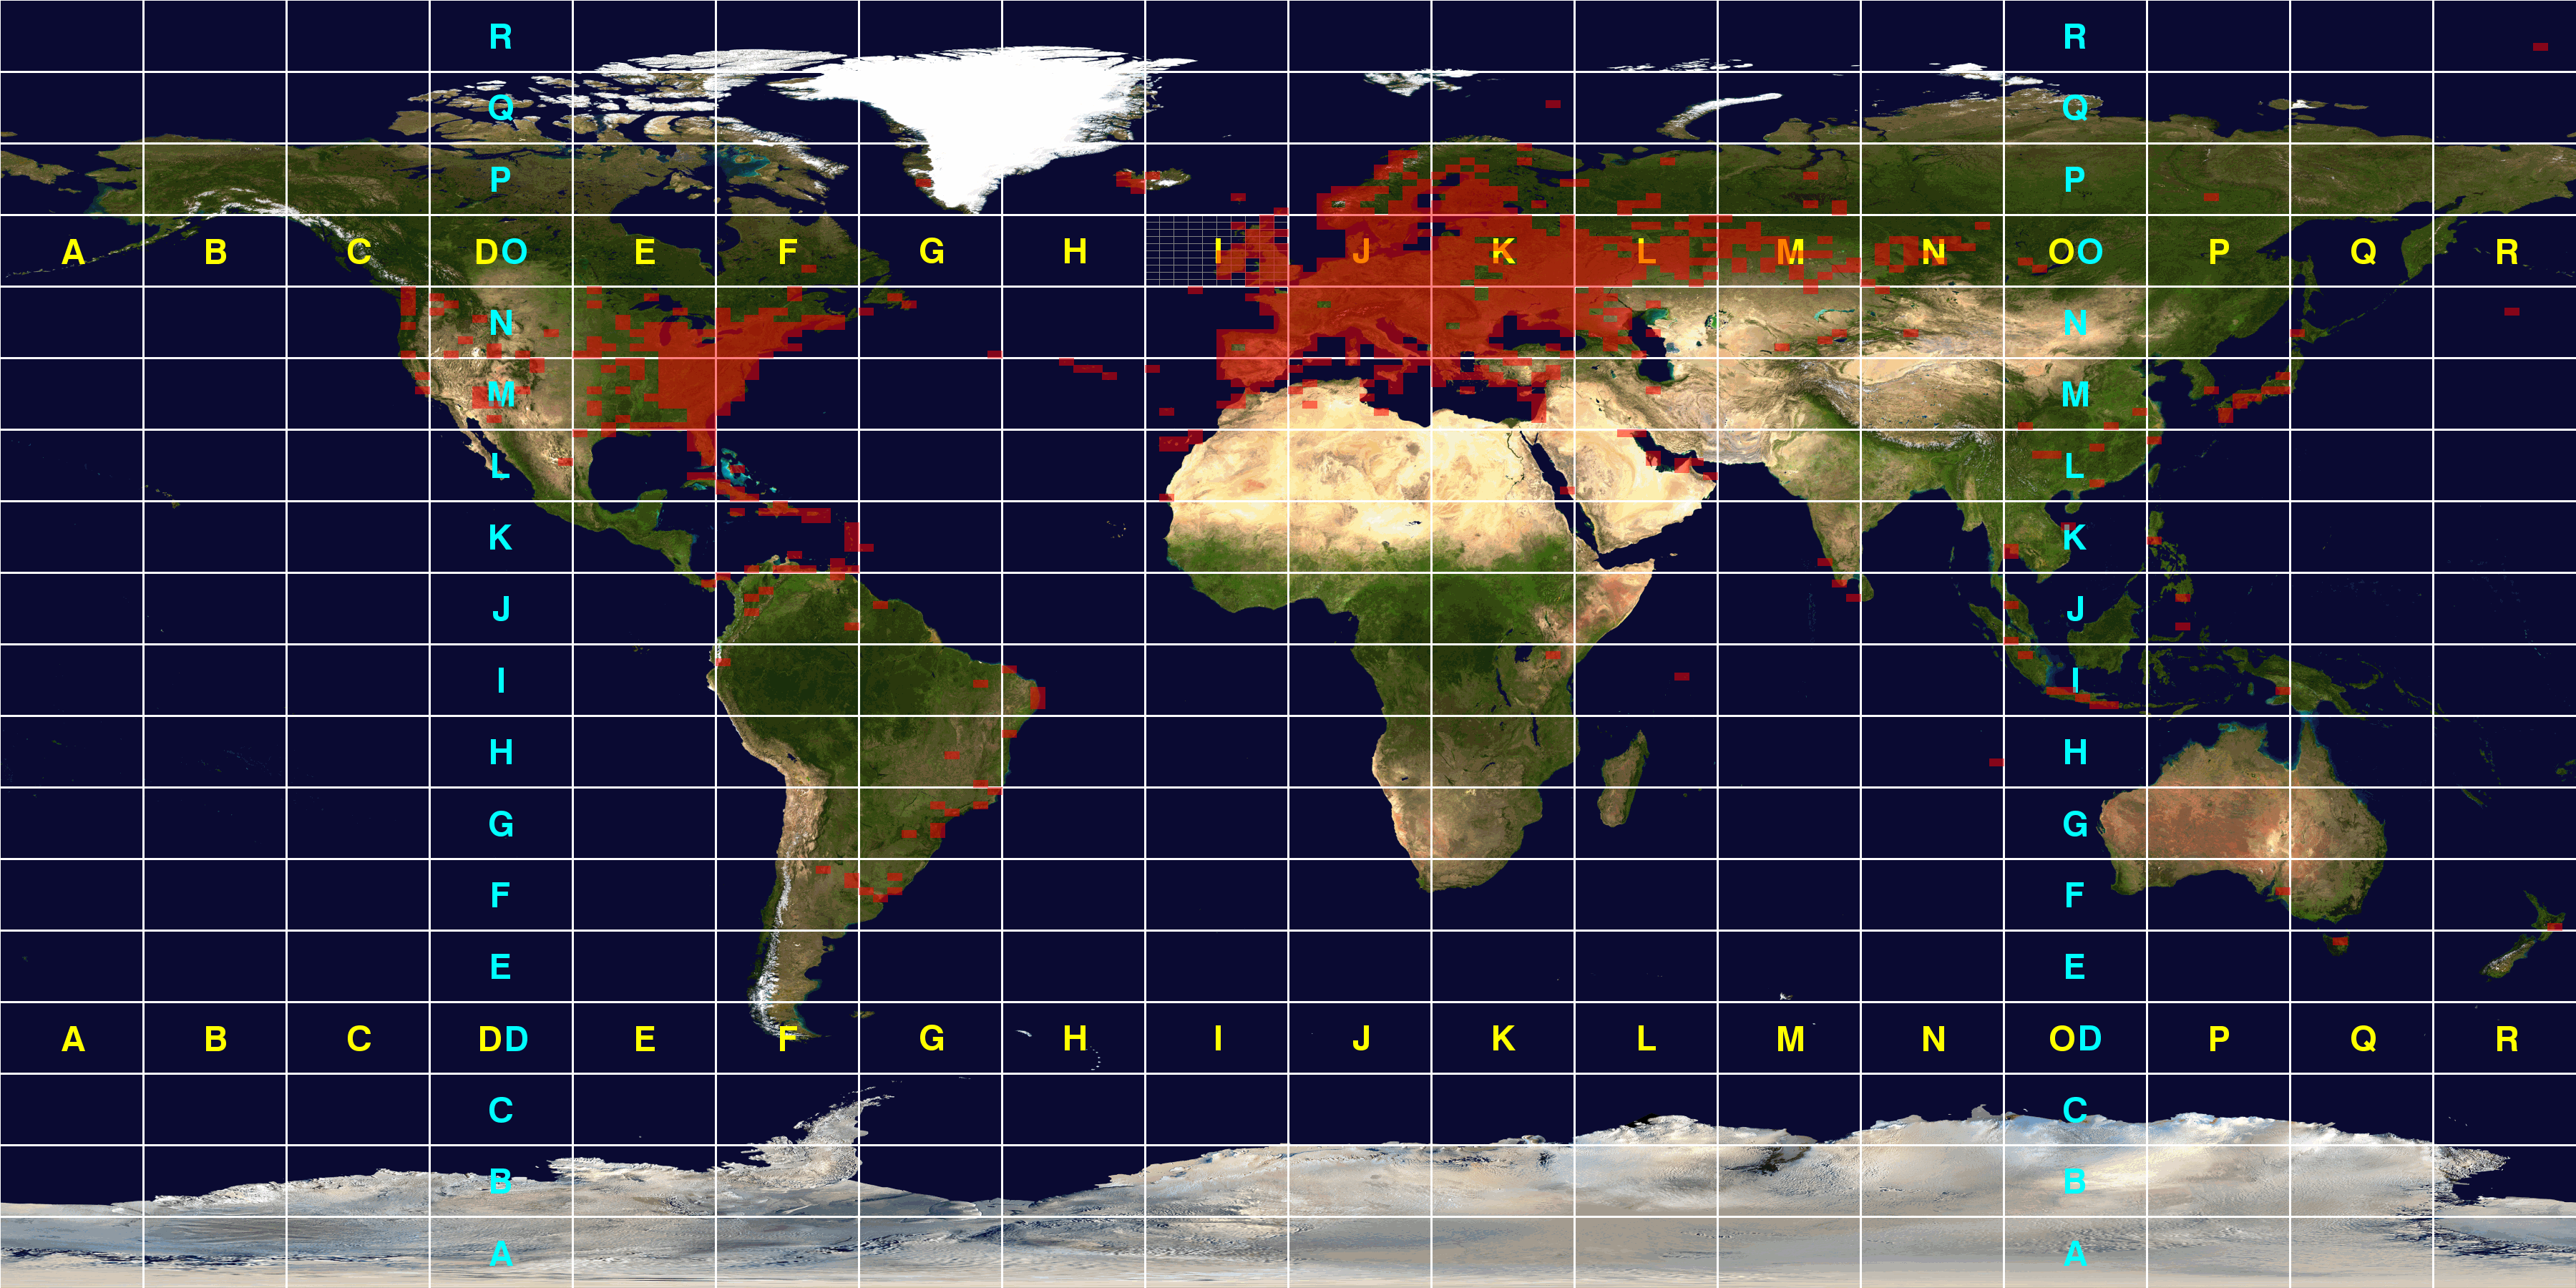
Ignore the top right one. That’s “RR73”, and not a real grid square. The rest should be accurate.
More that can be done (more interesting with more data than I can get, though):
- also take into account the received signal strength
- …and number of unique callsigns per grid square
- create animations over time
If I had access to the data from pskreporter I could even, instead of using just a callsign as input data, use a grid square as input.
So for example I could create an animation to show what the propagation was over the last week from any given gridsquare, and generate them on-demand.
Like last time the scripts are pretty hacky proof of concepts. But they work.
disqus has started showing ads. :-(
Showing (probably incomplete) comments in a static read-only view. Click button to be able to leave comments.